signal strength 1 of 5

The Triple Top pattern has formed on the chart of the #Bitcoin M5 trading instrument. It is a reversal pattern featuring the following characteristics: resistance level 50, support level -21012, and pattern’s width 47477. Forecast If the price breaks through the support level 82165.38, it is likely to move further down to 82748.85.
The M5 and M15 time frames may have more false entry points.
Xem thêm
- All
- Double Top
- Flag
- Head and Shoulders
- Pennant
- Rectangle
- Triangle
- Triple top
- All
- #AAPL
- #AMZN
- #Bitcoin
- #EBAY
- #FB
- #GOOG
- #INTC
- #KO
- #MA
- #MCD
- #MSFT
- #NTDOY
- #PEP
- #TSLA
- #TWTR
- AUDCAD
- AUDCHF
- AUDJPY
- AUDUSD
- EURCAD
- EURCHF
- EURGBP
- EURJPY
- EURNZD
- EURRUB
- EURUSD
- GBPAUD
- GBPCHF
- GBPJPY
- GBPUSD
- GOLD
- NZDCAD
- NZDCHF
- NZDJPY
- NZDUSD
- SILVER
- USDCAD
- USDCHF
- USDJPY
- USDRUB
- All
- M5
- M15
- M30
- H1
- D1
- All
- Buy
- Sale
- All
- 1
- 2
- 3
- 4
- 5
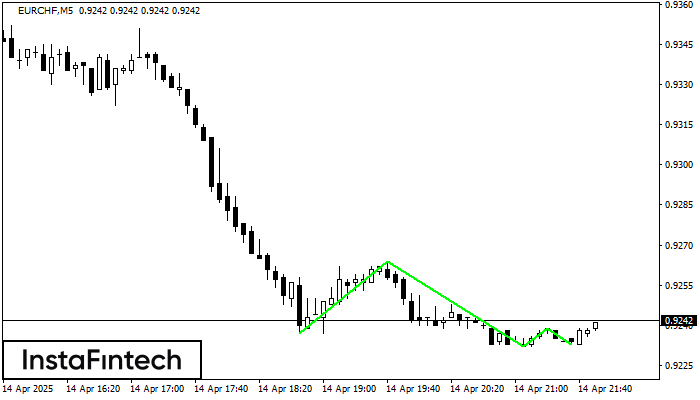
The Triple Bottom pattern has been formed on EURCHF M5. It has the following characteristics: resistance level 0.9264/0.9239; support level 0.9237/0.9233; the width is 27 points. In the event
The M5 and M15 time frames may have more false entry points.
Open chart in a new window
The Bearish Flag pattern has been formed on EURJPY at M30. The lower boundary of the pattern is located at 162.05/162.27 while the upper boundary lies at 162.33/162.55. The projection
Open chart in a new window
The Bearish pennant pattern has formed on the EURJPY M30 chart. It signals potential continuation of the existing trend. Specifications: the pattern’s bottom has the coordinate of 162.05; the projection
Open chart in a new window