empty
was formed on 26.03 at 06:30:15 (UTC+0)
signal strength 1 of 5
Bearish Symmetrical Triangle EURGBP M5

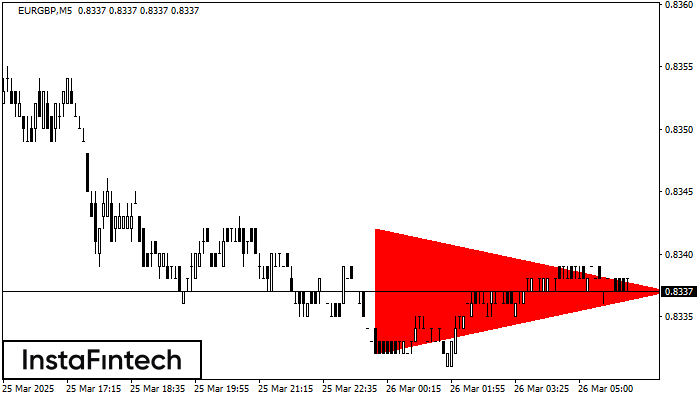
According to the chart of M5, EURGBP formed the Bearish Symmetrical Triangle pattern. Description: The lower border is 0.8332/0.8337 and upper border is 0.8342/0.8337. The pattern width is measured on the chart at -10 pips. The formation of the Bearish Symmetrical Triangle pattern evidently signals a continuation of the downward trend. In other words, if the scenario comes true and EURGBP breaches the lower border, the price could continue its move toward 0.8322.

The M5 and M15 time frames may have more false entry points.

Xem thêm

Figure
  • All
  • Double Top
  • Flag
  • Head and Shoulders
  • Pennant
  • Rectangle
  • Triangle
  • Triple top
Instrument
  • All
  • #AAPL
  • #AMZN
  • #Bitcoin
  • #EBAY
  • #FB
  • #GOOG
  • #INTC
  • #KO
  • #MA
  • #MCD
  • #MSFT
  • #NTDOY
  • #PEP
  • #TSLA
  • #TWTR
  • AUDCAD
  • AUDCHF
  • AUDJPY
  • AUDUSD
  • EURCAD
  • EURCHF
  • EURGBP
  • EURJPY
  • EURNZD
  • EURRUB
  • EURUSD
  • GBPAUD
  • GBPCHF
  • GBPJPY
  • GBPUSD
  • GOLD
  • NZDCAD
  • NZDCHF
  • NZDJPY
  • NZDUSD
  • SILVER
  • USDCAD
  • USDCHF
  • USDJPY
  • USDRUB
Timeframe
  • All
  • M5
  • M15
  • M30
  • H1
  • D1
Trend
  • All
  • Buy
  • Sale
Signal Strength
  • All
  • 1
  • 2
  • 3
  • 4
  • 5
Tam giác Cân Giảm
was formed on 01.04 at 09:18:41 (UTC+0)
signal strength 4 of 5
Tam giác Cân Giảm NZDJPY H1

Theo biểu đồ của H1, NZDJPY đã hình thành mô hình Tam giác Cân Giảm. Mô tả: Đường biên giới thấp hơn là 84.61/84.93 và đường biên giới

Open chart in a new window
Đáy đôi
was formed on 01.04 at 09:10:00 (UTC+0)
signal strength 1 of 5
Đáy đôi EURCAD M5

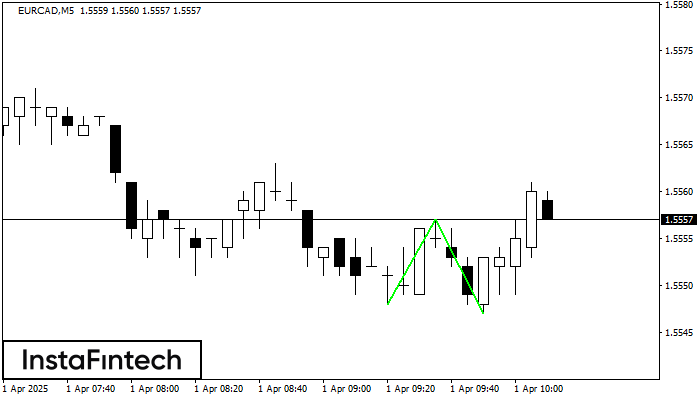
Mô hình Đáy đôi đã được hình thành trên EURCAD M5. Đặc điểm: mức hỗ trợ 1.5548; mức kháng cự 1.5557; chiều rộng của mô hình 9 điểm

Khung thời gian M5 và M15 có thể có nhiều điểm vào lệnh sai hơn.

Open chart in a new window
Tam giác Cân Giảm
was formed on 01.04 at 09:09:30 (UTC+0)
signal strength 3 of 5
Tam giác Cân Giảm NZDJPY M30

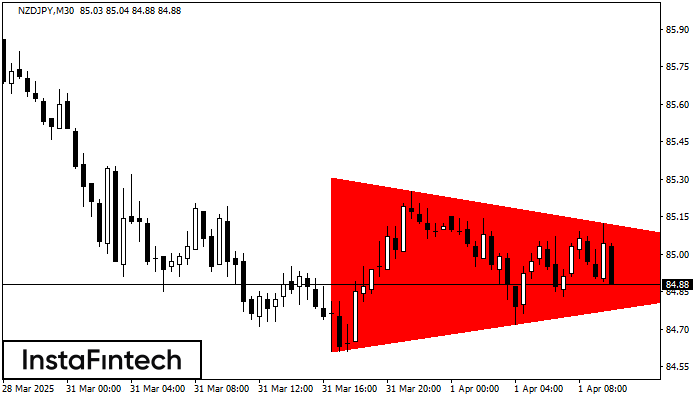
Theo biểu đồ của M30, NZDJPY đã hình thành mô hình Tam giác Cân Giảm. Mô hình này báo hiệu xu hướng giảm hơn nữa trong trường hợp đường biên

Open chart in a new window
Không thể nói chuyện ngay bây giờ?
Đặt câu hỏi của bạn trong phần trò chuyện.
Widget callback
 

Dear visitor,

Your IP address shows that you are currently located in the USA. If you are a resident of the United States, you are prohibited from using the services of InstaFintech Group including online trading, online transfers, deposit/withdrawal of funds, etc.

If you think you are seeing this message by mistake and your location is not the US, kindly proceed to the website. Otherwise, you must leave the website in order to comply with government restrictions.

Why does your IP address show your location as the USA?

  • - you are using a VPN provided by a hosting company based in the United States;
  • - your IP does not have proper WHOIS records;
  • - an error occurred in the WHOIS geolocation database.

Please confirm whether you are a US resident or not by clicking the relevant button below. If you choose the wrong option, being a US resident, you will not be able to open an account with InstaForex anyway.

We are sorry for any inconvenience caused by this message.