empty
31.01.2023 11:32 AM
EUR/USD and GBP/USD technical analysis on January 31, 2023

EUR/USD

This image is no longer relevant

Higher time frames

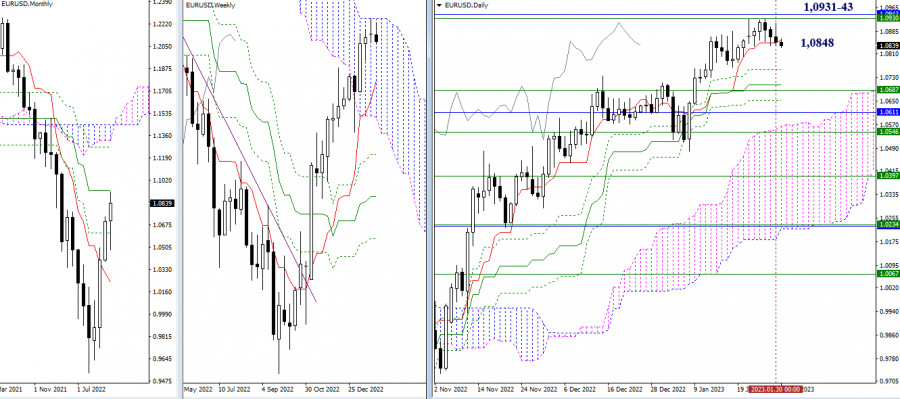
The situation has not changed much over the past 24 hours. The pair is still holding near the support level of the daily short-term trend (1.0848). Consolidation below this level and a further decline will bring the price to the lower levels of the daily Ichimoku Cross at 1.0759 – 1.0706 – 1.0653 and the weekly short-term trend at 1.0687. The bearish scenario is more likely in current conditions for various reasons. If bulls return to the market at some point, their main target will be the key resistance of 1.0931-43 (upper boundary of the weekly Ichimoku Cloud + monthly medium-term trend).

This image is no longer relevant

H4 – H1

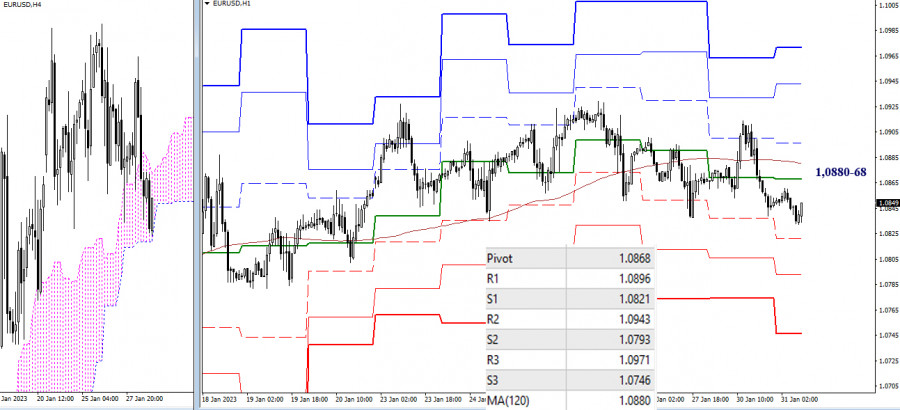
Bears are taking over the pair on lower time frames. The pair is currently trading below the central pivot level of 1.0868 and the weekly long-term trend of 1.0880. The next downward targets on the intraday chart are found at the support of standard pivot levels of 1.0821 – 1.0793 – 1.0746. A breakout of the Ichimoku Cloud on H4 and consolidation in the selling zone will support the bearish trend and will send the price for a new breakout.

***

GBP/USD

This image is no longer relevant

Higher time frames

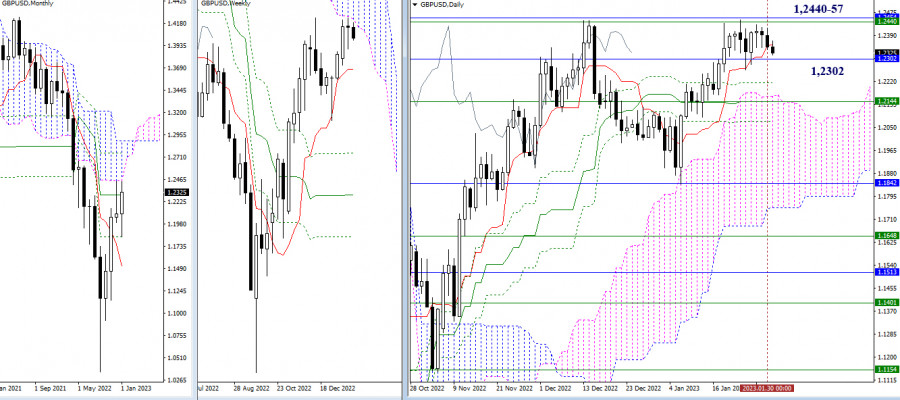
The daily short-term trend has slightly shifted from the level of 1.2302. The pair is still trading in the range between 1.2457-40 (upper boundaries of Ichimoku Clouds on monthly and weekly time frames) and 1.2302 (monthly medium-term trend). If the price leaves these boundaries, it may develop a new trajectory.

This image is no longer relevant

H4 – H1

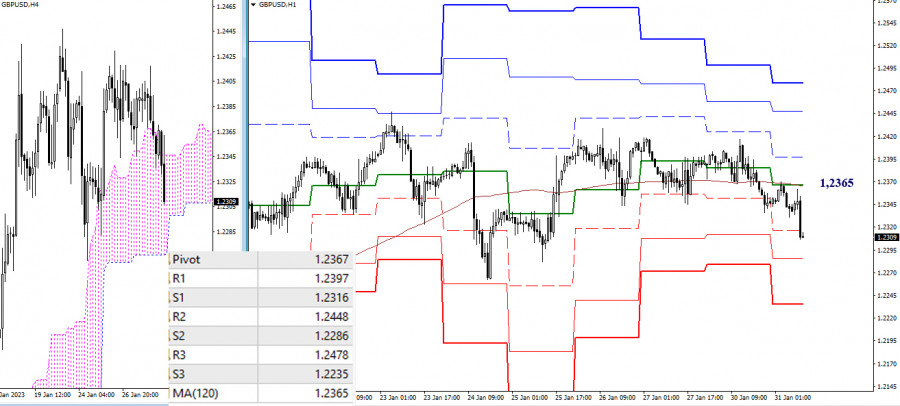
On lower time frames, the price has slipped below the key levels found at 1.2367-65 (central pivot level + weekly long-term trend). Trading below this range will support the sellers. Other intraday targets for bears are located at standard pivot levels of 1.2286 and 1.2235 as well as at the lower boundary of the cloud on H4. If the price settles outside the H4 cloud, it may head lower for new downward targets.

***

Technical analysis is based on:

Higher time frames – Ichimoku Kinko Hyo (9.26.52) + Fibo Kijun levels

Lower time frames – H1: Pivot Points (standard) + 120-day Moving Average (weekly long-term trend)

เลือกช่วงเวลา
5
นาที
15
นาที
30
นาที
1
ชั่วโมง
4
ชั่วโมง
1
วัน
1
สัปดาห์
รับผลกำไรจากการเปลี่ยนแปลงอัตราสกุลเงินดิจิทัลกับ InstaForex.
ดาวน์โหลด MetaTrader 4 และเปิดการซื้อขายครั้งแรกของคุณ.
  • Grand Choice
    Contest by
    InstaForex
    InstaForex always strives to help you
    fulfill your biggest dreams.
    เข้าร่วมการแข่งขัน


บทความแนะนำ

สัญญาณการซื้อขายทองคำ (XAU/USD) สำหรับวันที่ 3-5 เมษายน 2025: ซื้อที่ราคาสูงกว่า $3,055 (21 SMA - การฟื้นตัว)

ในช่วงต้นของการซื้อขายในอเมริกา ราคาทองคำอยู่ที่ประมาณ 3,065 ต่ำกว่าค่าเฉลี่ยเคลื่อนที่ 21 SMA โดยได้ทะลุช่องขาขึ้นที่เกิดขึ้นตั้งแต่วันที่ 10 มีนาคม หลังจากที่ราคาทองคำแตะระดับสูงใหม่ที่ 3,167 ทองคำได้กลับตัวอย่างรวดเร็วทางเทคนิคภายใต้แรงขายเพื่อทำกำไร โดยทำลายค่าเฉลี่ยเคลื่อนที่

Dimitrios Zappas 16:43 2025-04-03 UTC+2

EUR/USD – วันที่ 3 เมษายน: ดอลลาร์เผชิญกับการลดลงอีกครั้ง

ในวันพุธ คู่สกุลเงิน EUR/USD พุ่งขึ้นอย่างรุนแรง การเคลื่อนไหวนี้แทบจะไม่ได้เรียกว่าการขึ้นราคาเพียงอย่างเดียว ในส่วนของเงินดอลลาร์สหรัฐฯ นี่เป็นการพังทลายอีกครั้ง หนึ่งในครั้งหลายครั้งที่เห็นในปี 2025 ซึ่งถี่ขึ้นกว่าก่อนที่ Donald Trump จะขึ้นสู่อำนาจ จากช่วงเมื่อวานและเช้าวันนี้ คู่สกุลเงินได้ทะลุระดับ

Samir Klishi 11:25 2025-04-03 UTC+2

GBP/USD – วันที่ 3 เมษายน: ช่วงสุดสัปดาห์ที่ไร้จุดหมายสำหรับดอลลาร์

ในกราฟรายชั่วโมง คู่เงิน GBP/USD พุ่งขึ้นอีกครั้ง โดยทะลุผ่านระดับและโซนต้านทานหลายแห่งไปได้ ในขณะนี้ เงินปอนด์ของอังกฤษได้เพิ่มขึ้นมา 220 จุดแล้ว และราคากำลังเข้าใกล้ระดับที่ 1.3151 การยืนเหนือระดับนี้จะเพิ่มความเป็นไปได้ของการเติบโตต่อเนื่องไปยังระดับการแก้ไข Fibonacci ถัดไปที่ 161.8%

Samir Klishi 10:51 2025-04-03 UTC+2

การทำนายแนวโน้ม Forex วันที่ 03/04/2025: EUR/USD, USD/JPY, SP500, ทองคำ และ Bitcoin

ลิงก์ที่เป็นประโยชน์: บทความอื่น ๆ ของฉันสามารถเข้าชมได้ในส่วนนี้ คอร์ส InstaForex สำหรับผู้เริ่มต้น การวิเคราะห์ยอดนิยม เปิดบัญชีซื้อขาย สำคัญ: ผู้เริ่มต้นในตลาดซื้อขายฟอเร็กซ์จำเป็นต้องระมัดระวังเป็นพิเศษในการตัดสินใจเข้าตลาด ก่อนการเปิดเผยรายงานสำคัญ ควรอยู่ห่างจากตลาดเพื่อหลีกเลี่ยงการถูกผลกระทบจากความผันผวนอย่างรุนแรงของตลาด ในกรณีที่คุณตัดสินใจจะเทรดในช่วงมีการประกาศข่าว ควรตั้งคำสั่ง

Sebastian Seliga 09:57 2025-04-03 UTC+2

การคาดการณ์ EUR/USD สำหรับวันที่ 3 เมษายน 2025

เริ่มตั้งแต่วันนี้ อัตราภาษีศุลกากรของสหรัฐฯ ที่มีตั้งแต่ 10% ถึง 50% จะถูกบังคับใช้กับคู่ค้าของอเมริกาเกือบทั้งหมด ผู้ร่วมตลาดได้เตรียมตัวไว้แล้วและหลีกเลี่ยงการตื่นตระหนก แม้ว่าดัชนีหุ้นจะอ่อนตัวลงก็ตาม ในการตอบสนอง ความพยายามในการเสริมสร้างพันธมิตรการค้าระดับภูมิภาคและระดับโลกได้กลับมามีแรงผลักดันใหม่ เราได้ยินถึงการมุ่งเน้นใหม่ใน BRICS, ASEAN, APEC

Laurie Bailey 05:07 2025-04-03 UTC+2

การคาดการณ์ GBP/USD สำหรับวันที่ 3 เมษายน 2025

GBP/USD เมื่อวานนี้ อัตราภาษีศุลกากรที่กว้างขวางของ Trump ที่มีต่อตลาดค้าขายของสหรัฐส่งผลกระทบต่อสหราชอาณาจักรในอัตราที่ต่ำที่สุด เพียง 10% ในทางตรงกันข้าม อัตราภาษีศุลกากรต่อสินค้าของสหภาพยุโรปถูกตั้งไว้ที่ 20% และต่อสินค้าญี่ปุ่นอยู่ที่ 24% แน่นอนว่านี่เป็นข่าวดีสำหรับสหราชอาณาจักร และค่าเงินปอนด์อังกฤษได้ทะลุแนวต้านเป้าหมายแรกที่ 1.3001

Laurie Bailey 05:07 2025-04-03 UTC+2

การคาดการณ์ USD/JPY สำหรับวันที่ 3 เมษายน 2025

USD/JPY หลังจากที่วอชิงตันได้กำหนดภาษีนำเข้ากับสินค้าจากญี่ปุ่นที่อัตรา 24% ส่งผลให้ดัชนี Nikkei 225 ลดลง 2.71% ในช่วงการซื้อขายของภูมิภาคแปซิฟิกวันนี้ ค่าเงิน USD/JPY ลดลงประมาณ 150 pip บนกราฟรายวัน

Laurie Bailey 05:07 2025-04-03 UTC+2

การพยากรณ์ราคาน้ำมันสำหรับวันที่ 3 เมษายน 2025

น้ำมัน (CL) นักลงทุนในตลาดคาดการณ์การหยุดชะงักของการค้าโลกหลังจากประธานาธิบดีทรัมป์ได้กำหนดภาษีแบบครอบคลุมกับคู่ค้าทั้งหมดของสหรัฐเมื่อวานนี้ บนกราฟรายวัน ไส้เทียนด้านบนของแท่งเทียนล่าสุดได้ทะลุระดับแนวต้านและเส้น MACD เช้านี้ ราคาทดสอบตัวบ่งชี้เส้นสมดุล แต่ตอนนี้ได้ปักหลักแทบจะต่ำกว่าระดับ 70.58 ซึ่งเพิ่มโอกาสในการไปถึงเป้าหมายถัดไปที่ 68.69 ในจุดนั้น เส้นสัญญาณของออสซิลเลเตอร์ Marlin

Laurie Bailey 05:07 2025-04-03 UTC+2

#NDX – ผลลัพธ์เดือนมีนาคมและแนวโน้มเดือนเมษายน

เดือนมีนาคมสิ้นสุดลงด้วยแท่งเทียนขาลงที่สร้างประวัติศาสตร์ที่น่าจดจำ โดยกลุ่มผู้คุมขาลงสามารถปิดตลาดต่ำกว่าระดับแนวโน้มระยะสั้นในกราฟรายเดือน (19,730) และลบล้าง cross ทองคำรายสัปดาห์ โดยทดสอบแนวรับที่ขอบบนของกราฟรา Ichimoku รายสัปดาห์ (18,821) หากการลดระดับยังคงดำเนินต่อไป เป้าหมายขาลงจะรวมถึงการทดสอบและทะลุแนวรับรายเดือนถัดไป (18,204) และออกจากกราฟเมฆรายสัปดาห์ (17,408)

Evangelos Poulakis 01:07 2025-04-03 UTC+2

สัญญาณการเทรดสำหรับ EUR/USD สำหรับวันที่ 2-5 เมษายน 2025: ขายต่ำกว่า 1.0815 (21 SMA - +1/8 Murray)

หากยูโรทะลุและสามารถปรับฐานเหนือช่องแนวโน้มขาลงได้ เราอาจคาดว่ามันจะไปถึง +1/8 ระดับ Murray ที่ 1.0864 ในอีกไม่กี่วันข้างหน้า EUR/USD อาจไปถึง +2/8 ระดับ Murray ซึ่งตั้งอยู่ที่ 1.0986

Dimitrios Zappas 15:18 2025-04-02 UTC+2
หากไม่สะดวกคุยในตอนนี้
ระบุคำถามไว้ได้ใน แชท.
Widget callback
 

Dear visitor,

Your IP address shows that you are currently located in the USA. If you are a resident of the United States, you are prohibited from using the services of InstaFintech Group including online trading, online transfers, deposit/withdrawal of funds, etc.

If you think you are seeing this message by mistake and your location is not the US, kindly proceed to the website. Otherwise, you must leave the website in order to comply with government restrictions.

Why does your IP address show your location as the USA?

  • - you are using a VPN provided by a hosting company based in the United States;
  • - your IP does not have proper WHOIS records;
  • - an error occurred in the WHOIS geolocation database.

Please confirm whether you are a US resident or not by clicking the relevant button below. If you choose the wrong option, being a US resident, you will not be able to open an account with InstaForex anyway.

We are sorry for any inconvenience caused by this message.