empty
07.04.2025 10:20 AM
Weekly Forecast Based on Simplified Wave Analysis for GBP/USD, AUD/USD, USD/CHF, EUR/JPY, EUR/GBP, and US Dollar Index – April 7th

GBP/USD

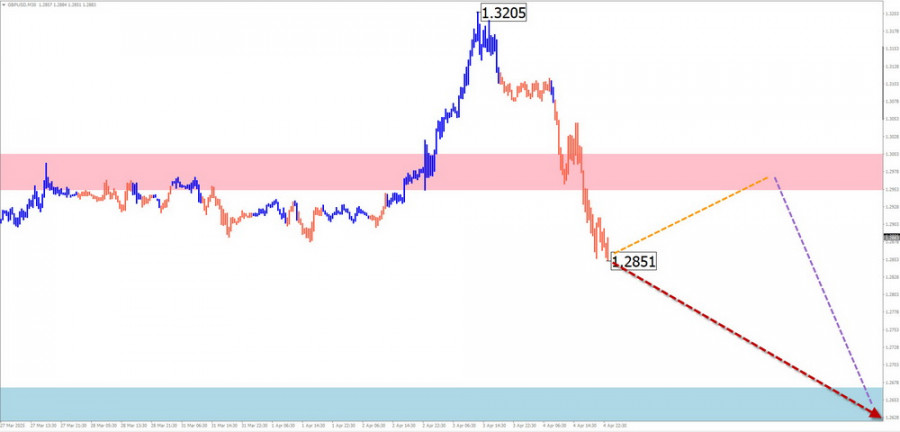
Analysis: Since January of this year, the upward wave has defined the price direction in the main British pound pair. After reaching the lower boundary of a powerful reversal zone, the price began to decline sharply, forming the beginning of a full correction.

Forecast: Sideways movement is expected in the first half of the week along resistance boundaries. Closer to the weekend, a price drop may resume, likely triggered by increased volatility after important news releases.

This image is no longer relevant

Potential Reversal Zones:

  • Resistance: 1.2950 / 1.3000
  • Support: 1.2670 / 1.2620

Recommendations:

  • Sales: No conditions for such trades are expected this week.
  • Buys: Only after confirmed reversal signals near the support zone.

AUD/USD

Analysis: Since December last year, the Australian dollar has continued to form a bearish wave against the US dollar. Last week, the middle wave segment (B) ended, and the final part began after breaking intermediate support. Currently, the price is pulling back toward that zone.

Forecast: A sideways tone with an upward bias is expected in the coming days. After potential resistance pressure, a reversal and decline to the support zone is likely.

This image is no longer relevant

Potential Reversal Zones:

  • Resistance: 0.6100 / 0.6150
  • Support: 0.5860 / 0.5810

Recommendations:

  • Buys: Risky and may result in losses.
  • Sells: Consider after confirmed reversal signals near resistance.

USD/CHF

Analysis: On the daily chart, the Swiss franc has been in a downtrend since the start of the year. Last week, price broke below major daily support. Further decline requires consolidation below that level.

Forecast: Expect horizontal drift within the resistance zone for a few days, then possible conditions for a trend reversal. Price decline may resume by the weekend. A sharp volatility spike and a false breakout above resistance cannot be ruled out.

This image is no longer relevant

Potential Reversal Zones:

  • Resistance: 0.8640 / 0.8690
  • Support: 0.8400 / 0.8350

Recommendations:

  • Buys: No valid conditions.
  • Sells: Only after confirmed reversal signals near resistance on your trading system.

EUR/JPY

Analysis: The daily chart of EUR/JPY continues to show a global uptrend. The pair reached the boundary of a major potential reversal zone. The current unfinished leg started on December 7, with a correction unfolding over the past two weeks.

Forecast: Sideways movement with a bullish tone is expected in the next couple of days. A reversal and resumption of decline toward the support zone is likely in the second half of the week.

This image is no longer relevant

Potential Reversal Zones:

  • Resistance: 161.40 / 161.90
  • Support: 158.60 / 158.10

Recommendations:

  • Buys: Low potential, high risk.
  • Sells: Consider after confirmed reversal signals near resistance.

EUR/GBP

Analysis: The EUR/GBP cross has followed a downward wave since August of last year. Since December, a contracting corrective flat has been forming. The current structure remains incomplete, with the latest segment beginning on April 3.

Forecast: Upward movement is likely to continue early in the week until it completes near the resistance zone. A reversal and downward move toward the lower boundary of the price channel may follow.

This image is no longer relevant

Potential Reversal Zones:

  • Resistance: 0.8550 / 0.8600
  • Support: 0.8350 / 0.8300

Recommendations:

  • Buys: Limited potential.
  • Sells: May be considered after confirmed reversal signals near resistance.

US Dollar Index

Brief Analysis: Since early February, the short-term trend on the US Dollar Index has been downward. A corrective segment (B) is unfolding. Since the end of last week, the price has bounced from intermediate support, forming the final leg of the correction.

Weekly Forecast: Expect continued sideways movement with a general upward bias. After a possible early-week pullback to support, the dollar may resume rising. The weekly volatility range is outlined by the calculated opposing zones.

This image is no longer relevant

Potential Reversal Zones:

  • Resistance: 103.90 / 104.10
  • Support: 102.30 / 102.10

Recommendations: No sharp movements are expected in the USD in the next few days. Short-term trades on weakening national currencies in major pairs may be relevant if reversal signals appear near support.

Note: In simplified wave analysis (SWA), all waves consist of 3 parts (A-B-C). The analysis focuses on the last incomplete wave in each timeframe. Dashed lines indicate expected movements.

Important: The wave algorithm does not account for the duration of price movements over time.

GBPUSD
Great Britain Pound vs US Dollar
Ringkasan
Jual
Segera
1 minggu
Analitic
Vyacheslav Ognev
Mulakan perdagangan
Jana pendapatan melalui perubahan kadar mata wang kripto dengan InstaForex.
Muat turun MetaTrader 4 dan buka dagangan pertama anda.
  • Grand Choice
    Contest by
    InstaForex
    InstaForex always strives to help you
    fulfill your biggest dreams.
    SERTAI PERADUAN

Artikel yang dicadangkan

Ramalan Mingguan Berdasarkan Analisis Gelombang Terperinci untuk GBP/USD, AUD/USD, USD/CHF, EUR/JPY, AUD/JPY, dan Indeks Dolar AS — 21 April

GBP/USD Analisis: Sejak awal tahun ini, GBP/USD telah membentuk gelombang menaik pada carta harian. Pasangan mata wang ini kini telah mencapai sempadan zon pembalikan potensi yang luas. Pada masa analisis

Isabel Clark 09:31 2025-04-21 UTC+2

Ramalan Mingguan Berdasarkan Analisis Gelombang Ringkas untuk EUR/USD, USD/JPY, GBP/JPY, USD/CAD, NZD/USD dan Emas – 21 April

EUR/USD Analisis: Sejak bulan Februari, EUR/USD sedang membentuk gelombang menaik, dengan bahagian akhir (C) kini sedang berlangsung. Baru-baru ini, pasangan ini telah menembusi sempadan bawah zon pembalikan potensi yang kuat

Isabel Clark 09:25 2025-04-21 UTC+2

Analisis EUR/USD pada 17 April 2025

Struktur gelombang pada carta 4 jam EUR/USD telah berubah kepada formasi impuls menaik. Saya percaya tidak ada keraguan bahawa transformasi ini berlaku semata-mata disebabkan dasar perdagangan baharu Amerika Syarikat. Sehingga

Chin Zhao 19:12 2025-04-17 UTC+2

Analisis GBP/USD pada 17 April 2025

Pasangan GBP/USD kekal tidak berubah pada hari Khamis. Walaupun tingkah laku pasaran sedemikian mungkin dijangka pada hari Khamis, adalah mengejutkan tiada penurunan pada hari Rabu, melihat kepada bilangan faktor fundamental

Chin Zhao 19:09 2025-04-17 UTC+2

Analisis untuk EUR/USD pada 16 April 2025

Struktur gelombang pada carta 4 jam pasangan EUR/USD telah berubah kepada formasi menaik. Saya berpendapat hampir tiada keraguan bahawa transformasi ini semata-mata disebabkan oleh dasar perdagangan baharu AS. Sehingga

Chin Zhao 18:56 2025-04-16 UTC+2

Analisis untuk GBP/USD pada 16 April 2025

Struktur gelombang pasangan GBP/USD juga telah berubah menjadi pembentukan impulsif yang menaik — "terima kasih" kepada Donald Trump. Corak gelombang hampir sama dengan EUR/USD. Sehingga 28 Februari, kami menyaksikan struktur

Chin Zhao 18:53 2025-04-16 UTC+2

Analisis untuk EUR/USD pada 15 April 2025

Struktur gelombang pada carta 4 jam untuk EUR/USD telah beralih ke dalam pembentukan kenaikan harga. Saya percaya terdapat sedikit keraguan bahawa transformasi ini adalah sepenuhnya hasil daripada dasar perdagangan baru

Chin Zhao 19:03 2025-04-15 UTC+2

Analisis untuk GBP/USD pada 15 April 2025

Struktur gelombang untuk GBP/USD juga telah berubah menjadi formasi menaik yang bersifat impulsif — "terima kasih" kepada Donald Trump. Corak gelombang ini hampir sama dengan EUR/USD. Sehingga 28 Februari, kita

Chin Zhao 18:56 2025-04-15 UTC+2

Analisis untuk GBP/USD pada 14 April 2025

Struktur gelombang bagi pasangan GBP/USD juga telah beralih kepada formasi impulsif yang menaik — terima kasih kepada Donald Trump. Corak gelombang ini kelihatan hampir sama dengan pasangan EUR/USD. Sehingga

Chin Zhao 19:09 2025-04-14 UTC+2

Analisis untuk EUR/USD pada 14 April 2025

Struktur gelombang pada carta 4 jam untuk pasangan EUR/USD telah beralih kepada pembentukan menaik. Saya percaya tidak ada keraguan bahawa peralihan ini berlaku semata-mata disebabkan oleh dasar perdagangan baru Amerika

Chin Zhao 19:05 2025-04-14 UTC+2
Tidak boleh bertanya sekarang?
Tanya soalan anda di Ruangan bersembang.
Panggilan semula Widget
 

Dear visitor,

Your IP address shows that you are currently located in the USA. If you are a resident of the United States, you are prohibited from using the services of InstaFintech Group including online trading, online transfers, deposit/withdrawal of funds, etc.

If you think you are seeing this message by mistake and your location is not the US, kindly proceed to the website. Otherwise, you must leave the website in order to comply with government restrictions.

Why does your IP address show your location as the USA?

  • - you are using a VPN provided by a hosting company based in the United States;
  • - your IP does not have proper WHOIS records;
  • - an error occurred in the WHOIS geolocation database.

Please confirm whether you are a US resident or not by clicking the relevant button below. If you choose the wrong option, being a US resident, you will not be able to open an account with InstaForex anyway.

We are sorry for any inconvenience caused by this message.