signal strength 1 of 5
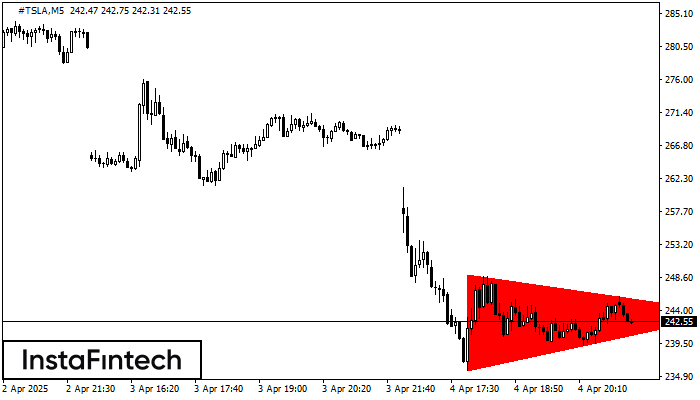
According to the chart of M5, #TSLA formed the Bearish Symmetrical Triangle pattern. Description: The lower border is 235.81/243.68 and upper border is 249.04/243.68. The pattern width is measured on the chart at -1323 pips. The formation of the Bearish Symmetrical Triangle pattern evidently signals a continuation of the downward trend. In other words, if the scenario comes true and #TSLA breaches the lower border, the price could continue its move toward 243.53.
The M5 and M15 time frames may have more false entry points.
Lihat juga
- All
- Double Top
- Flag
- Head and Shoulders
- Pennant
- Rectangle
- Triangle
- Triple top
- All
- #AAPL
- #AMZN
- #Bitcoin
- #EBAY
- #FB
- #GOOG
- #INTC
- #KO
- #MA
- #MCD
- #MSFT
- #NTDOY
- #PEP
- #TSLA
- #TWTR
- AUDCAD
- AUDCHF
- AUDJPY
- AUDUSD
- EURCAD
- EURCHF
- EURGBP
- EURJPY
- EURNZD
- EURRUB
- EURUSD
- GBPAUD
- GBPCHF
- GBPJPY
- GBPUSD
- GOLD
- NZDCAD
- NZDCHF
- NZDJPY
- NZDUSD
- SILVER
- USDCAD
- USDCHF
- USDJPY
- USDRUB
- All
- M5
- M15
- M30
- H1
- D1
- All
- Buy
- Sale
- All
- 1
- 2
- 3
- 4
- 5
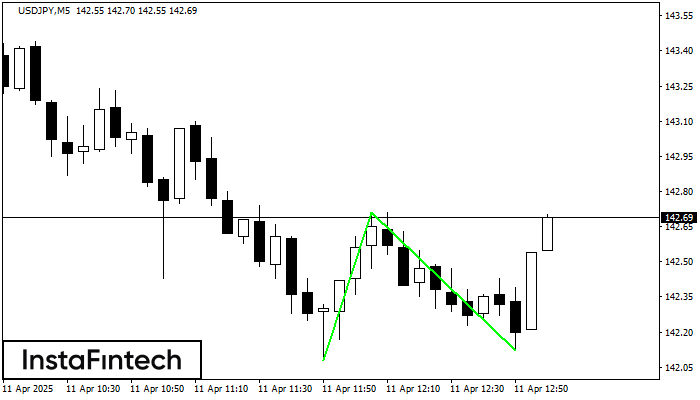
Pola Bawah Ganda telah terbentuk pada USDJPY M5. Karakteristik: level support 142.08; level resistance 142.71; lebar pola 63 poin. Jika level resistance ditembus, perubahan dalam tren dapat diprediksi dengan target
Rangka waktu M5 dan M15 mungkin memiliki lebih dari titik entri yang keliru.
Open chart in a new window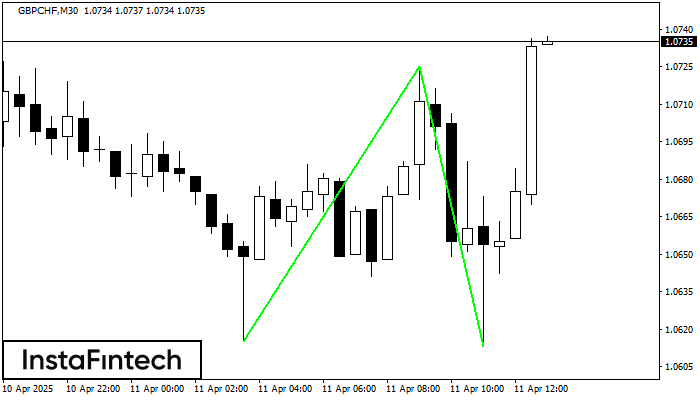
Pola Bawah Ganda telah terbentuk pada GBPCHF M30; batas atas di 1.0725; batas bawah di 1.0613. Lebar pola sebesar 110 poin. Jika harga menembus batas atas 1.0725, Perubahan dalam tren
Open chart in a new window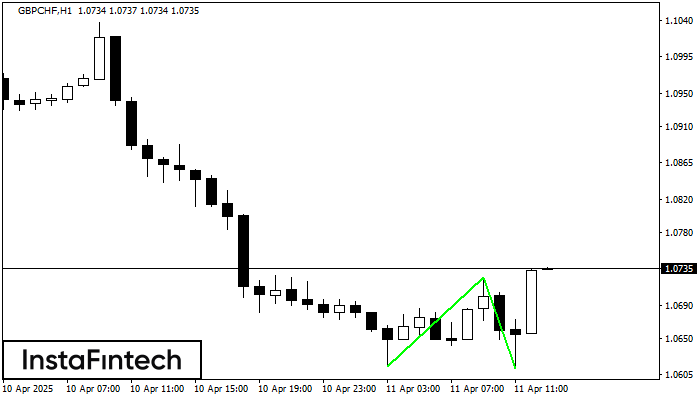
Pola Bawah Ganda telah terbentuk pada GBPCHF H1; batas atas di 1.0725; batas bawah di 1.0613. Lebar pola sebesar 110 poin. Jika harga menembus batas atas 1.0725, Perubahan dalam tren
Open chart in a new window