signal strength 2 of 5
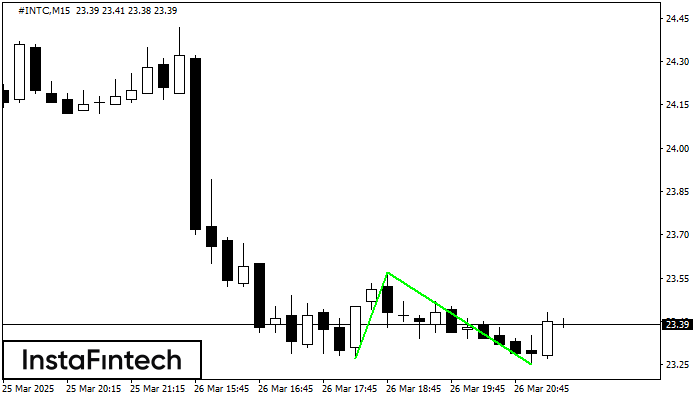
The Double Bottom pattern has been formed on #INTC M15. Characteristics: the support level 23.27; the resistance level 23.57; the width of the pattern 30 points. If the resistance level is broken, a change in the trend can be predicted with the first target point lying at the distance of 32 points.
The M5 and M15 time frames may have more false entry points.
See Also
- All
- Double Top
- Flag
- Head and Shoulders
- Pennant
- Rectangle
- Triangle
- Triple top
- All
- #AAPL
- #AMZN
- #Bitcoin
- #EBAY
- #FB
- #GOOG
- #INTC
- #KO
- #MA
- #MCD
- #MSFT
- #NTDOY
- #PEP
- #TSLA
- #TWTR
- AUDCAD
- AUDCHF
- AUDJPY
- AUDUSD
- EURCAD
- EURCHF
- EURGBP
- EURJPY
- EURNZD
- EURRUB
- EURUSD
- GBPAUD
- GBPCHF
- GBPJPY
- GBPUSD
- GOLD
- NZDCAD
- NZDCHF
- NZDJPY
- NZDUSD
- SILVER
- USDCAD
- USDCHF
- USDJPY
- USDRUB
- All
- M5
- M15
- M30
- H1
- D1
- All
- Buy
- Sale
- All
- 1
- 2
- 3
- 4
- 5
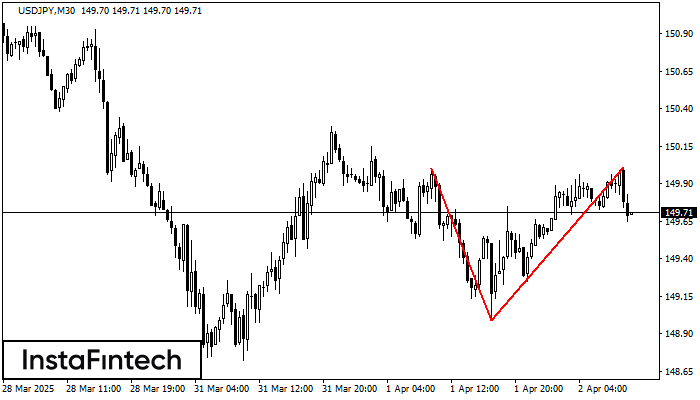
The Double Top reversal pattern has been formed on USDJPY M30. Characteristics: the upper boundary 150.00; the lower boundary 148.99; the width of the pattern is 102 points. Sell trades
Open chart in a new window
The NZDJPY M5 formed the Head and Shoulders pattern with the following features: The Head’s top is at 85.95, the Neckline and the upward angle are at 85.69/85.68. The formation
The M5 and M15 time frames may have more false entry points.
Open chart in a new window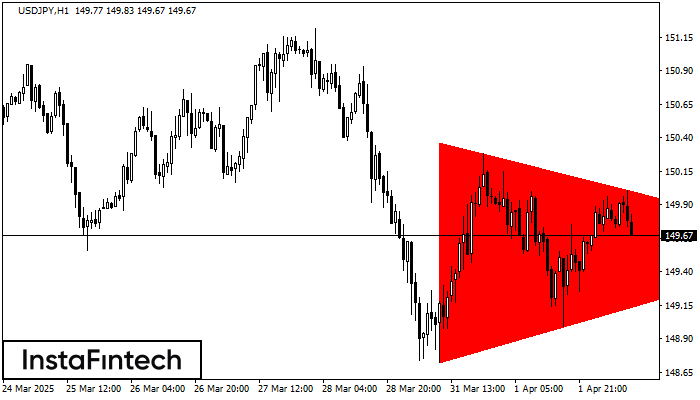
According to the chart of H1, USDJPY formed the Bearish Symmetrical Triangle pattern. Trading recommendations: A breach of the lower border 148.72 is likely to encourage a continuation
Open chart in a new window