empty
 
 
23.12.2024 05:10 PM
EUR/USD: Trading Plan for the U.S. Session on December 23rd (Analysis of Morning Trades)

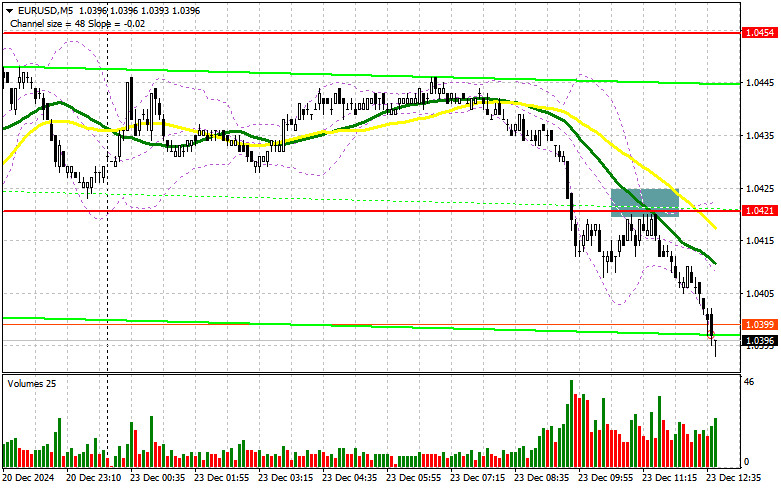
In my morning forecast, I highlighted the 1.0421 level and planned to make trading decisions based on it. Let's look at the 5-minute chart to analyze what happened. A breakout and retest of this level provided an excellent entry point for selling the euro. At the time of writing, the pair had already dropped by over 30 points from the entry point. The technical outlook for the second half of the day has been revised.

This image is no longer relevant

For Opening Long Positions on EUR/USD:

Amid a lack of significant statistics, the euro was quickly brought back down, casting doubt on further upward movement. In the second half of the day, focus will be on key data regarding the U.S. Consumer Confidence Index, which could surprise the upside and support U.S. dollar buyers.

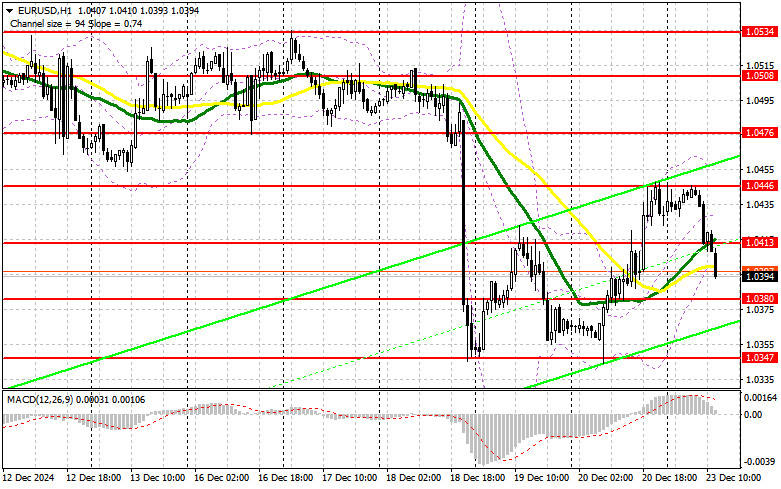
If strong data pushes the pair lower, only a false breakout around 1.0380, a support level formed last week, will provide a suitable condition for building long positions in anticipation of a return to 1.0413. A breakout and retest of this range, similar to the morning scenario, will confirm the validity of an entry point for buying, targeting a move towards 1.0446. The farthest target will be the 1.0476 maximum, where I plan to take profits.

In the event of a decline in EUR/USD and inactivity around 1.0380 in the second half of the day—likely to occur—the pressure on the pair will increase, leading to a more significant drop. In this case, I will only enter long positions after a false breakout around the weekly low and support at 1.0347. Immediate long positions can be opened on a rebound from 1.0308, targeting an upward correction of 30–35 points intraday.

For Opening Short Positions on EUR/USD:

If the euro rises on weak U.S. data, protecting the 1.0413 resistance will be a priority for sellers. A false breakout at this level will restore bearish momentum and provide a short entry point with the prospect of a decline to 1.0380. A breakout and consolidation below this range, along with a retest from below, will offer another opportunity to sell, aiming for the 1.0347 low, which would undermine any buyer plans for further corrections. The farthest target will be the 1.0308 level, where I plan to take profits.

If EUR/USD moves higher in the second half of the day and bears fail to act at 1.0413, where moving averages currently favor sellers, I'll postpone short positions until the next resistance at 1.0446. I'll sell there only after a failed consolidation. Immediate short positions can be opened on a rebound from 1.0476, targeting a downward correction of 30–35 points.

This image is no longer relevant

Key Points from the Commitment of Traders (COT) Report:

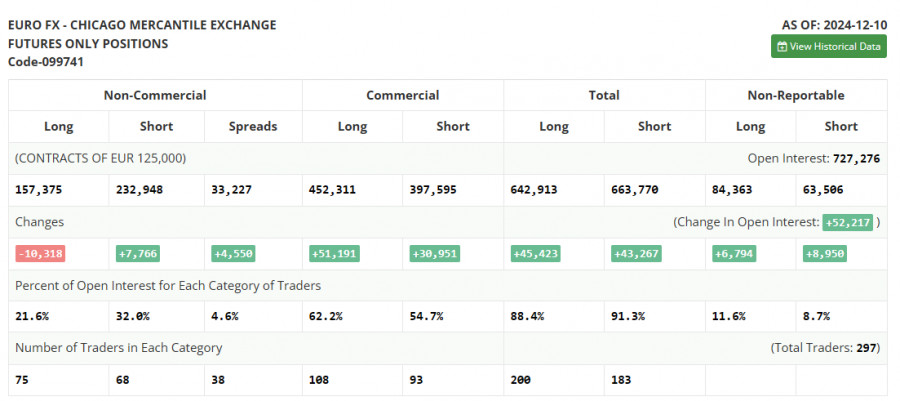
In the December 10 COT report, an increase in short positions and a decrease in long positions was observed. However, the overall market balance remained unchanged. The Federal Reserve's final meeting of the year is approaching, where a decision to reduce interest rates is likely to be made, sustaining demand for risk assets while capping the dollar's growth.

According to the COT report:

  • Long non-commercial positions fell by 10,318 to 157,375.
  • Short non-commercial positions increased by 7,766 to 232,948.
  • The net position gap widened by 4,450.

This image is no longer relevant

Indicator Signals:

Moving Averages:

Trading near the 30- and 50-day moving averages indicates a sideways market.

Note: Moving average periods and prices are based on the H1 hourly chart and differ from the traditional daily D1 chart.

Bollinger Bands:

The lower boundary of the indicator at 1.0398 acts as support in case of a decline.

Indicator Description:

  • Moving Average (MA): Smoothens price volatility and noise.
    • Period: 50 (yellow on the chart)
    • Period: 30 (green on the chart)
  • MACD (Moving Average Convergence/Divergence):
    • Fast EMA: 12
    • Slow EMA: 26
    • SMA: 9
  • Bollinger Bands: Period 20
  • Non-commercial traders: Speculators such as individual traders, hedge funds, and institutions using the futures market for speculative purposes.
  • Long positions represent total open long positions.
  • Short positions represent total open short positions.
  • Net position: Difference between short and long positions.
Miroslaw Bawulski,
ইন্সটাফরেক্সের বিশ্লেষণ বিশেষজ্ঞ
© 2007-2024
EURUSD
Euro vs US Dollar
Summary
বিক্রয়
Urgency
1 দিন
Analytic
Maxim Magdalinin
Start trade
ইনস্টাফরেক্স দিয়ে ক্রিপ্টোমুদ্রা দর পরিবর্তনে আয় করুন।
মেটাট্রেডার 4 ডাউনলোড করে আপনার প্রথম ট্রেড চালু করুন।
  • Grand Choice
    Contest by
    InstaForex
    InstaForex always strives to help you
    fulfill your biggest dreams.
    প্রতিযোগীতায় অংশগ্রহণ করুন
  • চ্যান্সি ডিপোজিট
    আপনার অ্যাকাউন্টে $3,000 জমা করুন এবং $6000 এর অধিক নিন!
    চ্যান্সি ডিপোজিট প্রচারাভিযানে আমরা ডিসেম্বর $6000 লটারি করেছি! একটি ট্রেডিং অ্যাকাউন্টে $3,000 জমা করে এই অর্থ জেতার একটি সুযোগ নিন! এই শর্ত পূরণ করে, আপনি একজন অংশগ্রহণকারী হতে পারবেন।
    প্রতিযোগীতায় অংশগ্রহণ করুন
  • বুদ্ধিমত্তার সাথে ট্রেড করুন, ডিভাইস জিতুন
    আপনার অ্যাকাউন্টে কমপক্ষে $৫০০ টপ আপ করুন, প্রতিযোগিতার জন্য সাইন আপ করুন এবং মোবাইল ডিভাইস জেতার সুযোগ পান।
    প্রতিযোগীতায় অংশগ্রহণ করুন
  • ১০০% বোনাস
    আপনার ডিপোজিটের উপর ১০০% বোনাস পাওয়ার অনন্য সুযোগ
    বোনাস পান
  • ৫৫% বোনাস
    আপনার অ্যাকাউন্টে প্রতিটি ডিপোজিটের উপর ৫৫% বোনাসের জন্য আবেদন করুন
    বোনাস পান
  • ৩০% বোনাস
    প্রতিবার আপনার অ্যাকাউন্ট টপ আপ করার সময় ৩০% বোনাস নিন
    বোনাস পান

সুপারিশকৃত নিবন্ধ

এখন কথা বলতে পারবেন না?
আপনার প্রশ্ন জিজ্ঞাসা করুন চ্যাট.
Widget callback